The Dashboard is where you land after signing in. It answers four questions at a glance — how much stock is here, whose it is, how full are we, and what money is owed — then lets you click any number to break it down. This page explains every tile, every sub-number inside a tile, every chart, and how the drilldowns work.

The filter bar — four axes on everything
A single filter bar sits above the whole dashboard, and every tile, chart, and drilldown reads from it. There are four axes:
- Date range — chips for 7 days, 30 days, 90 days, and YTD (year-to-date, the default).
- Location — one, several, or all of your warehouses.
- Commodity — filter to a single crop/goods type.
- Client — filter to one depositor.
Change any filter and the tiles, banner, and any open drilldown refresh together.
Not every number obeys every axis — by design. Point-in-time numbers (net stock, occupancy) are snapshots of right now, so the date chip does not change them — the "opening" line absorbs everything before the window instead. Money totals pin their own window (YTD or an aging ladder) and also ignore the date chip for the headline figure. Where an axis is deliberately ignored it is called out below.
The live banner
A thin scrolling strip along the top shows today's movement: bags and entry counts for Inward and Outward, and — if Gate Pass is turned on for your tenant — vehicles In, Out, and currently At-gate. It counts today (rolling to yesterday when today is empty) and refreshes about every 30 seconds, so it moves on its own as the day's work is booked.
The KPI tiles
There are up to four tiles. Staff see the two operational tiles only — Net Stock and Occupancy. The two money tiles (Clients and Bills Outstanding) appear only for revenue roles (admin, manager, accountant, executive); this is decided by your role on the server, never by the page.
Each tile is a button — click it to open its drilldown (see below).
About the little squiggle lines: the small trend lines drawn inside the Net Stock, Clients, and Bills tiles are decorative — they hint at a shape, not a value. The real numbers in each tile are the two labelled mini-cards at the bottom of the tile. The one exception is the Occupancy ring, which is drawn to scale (see Occupancy).
Net Stock
- Headline (bags) — the stock physically here right now: total inward minus total outward, as a running balance. This is a snapshot, so the date chip does not move it.
- Opening line — the balance carried into the current window.
- Mini-card "Bags ·
" — Inward and Outward bag counts within the selected date window. These two do respond to the date chip (they are the flow, not the balance). Hovering shows the number of entries behind each. - Mini-card "Bonded · bags" — Bonded = bags pledged as collateral; Remaining = bags still authorised to move across all active Release Orders. A warning icon appears if any bonded lot is under-collateralised.
- Axes: location · commodity · client (the balance is date-invariant; the window mini-card tracks the date chip).
Clients (revenue roles)
- Headline — the number of distinct clients with any inward or outward activity in the selected date window.
- Mini-card "Reserved" — clients who hold reserved space, and the total reserved bags. Location-scoped only.
- Mini-card "Bonds" — clients with live bonds, and how many bonds are pending signature. Location-scoped only.
- Axes: all four for the headline; the two mini-cards honour location only.
Occupancy
- Headline (%) — how full the in-scope space is. The numerator (used) is the same net-stock snapshot as the Net Stock tile, so the two always reconcile (see the rule below). The denominator is the physical chamber + bin capacity in scope.
- Verandah tag — bags waiting in the staging area (not yet put away).
- Opening line — occupancy carried into the window, shown as a %.
- Mini-card "Space · bags" — Used vs Capacity in bags.
- Mini-card "Active" — how many Locations and how many Goods (commodities) are active in scope.
- The ring gauge is real — the arc fills to the headline %. It is not clamped: a value over 100% means you are over capacity (usually verandah / at-gate bags that have no assigned slot yet), which is a signal, not a bug.
- Axes: location · commodity · client. Date is exempt — it is a snapshot.
Bills Outstanding (revenue roles)
- Headline (₹) — the lifetime unpaid + partially-paid balance: billed minus collected minus discounts, floored at zero.
- Opening line — the balance carried in, plus a count of clients with bills overdue by more than 90 days.
- Mini-card "Billed · YTD" — total billed year-to-date.
- Mini-card "Less · YTD" — Collected and Discount year-to-date.
- These reconcile: Opening + Billed − Collected − Discount = Outstanding.
- Axes: location · commodity · client. Date is exempt — the headline is lifetime and the mini-cards pin YTD. Location is resolved through the bill's delivery anchor (see the rule below).
Recent activity
Below the tiles, the Overview tab lists the last 50 transactions — client, type, bags, commodity, chamber (and location when you run more than one), and date. Sort any column to scan the most recent work.
Drilldowns — clicking a tile
Click a tile and it opens a split view: a ranked breakdown on the left, a set of chart tabs on the right. (Drilldowns are a plan feature; the money drilldowns also require a revenue role.)
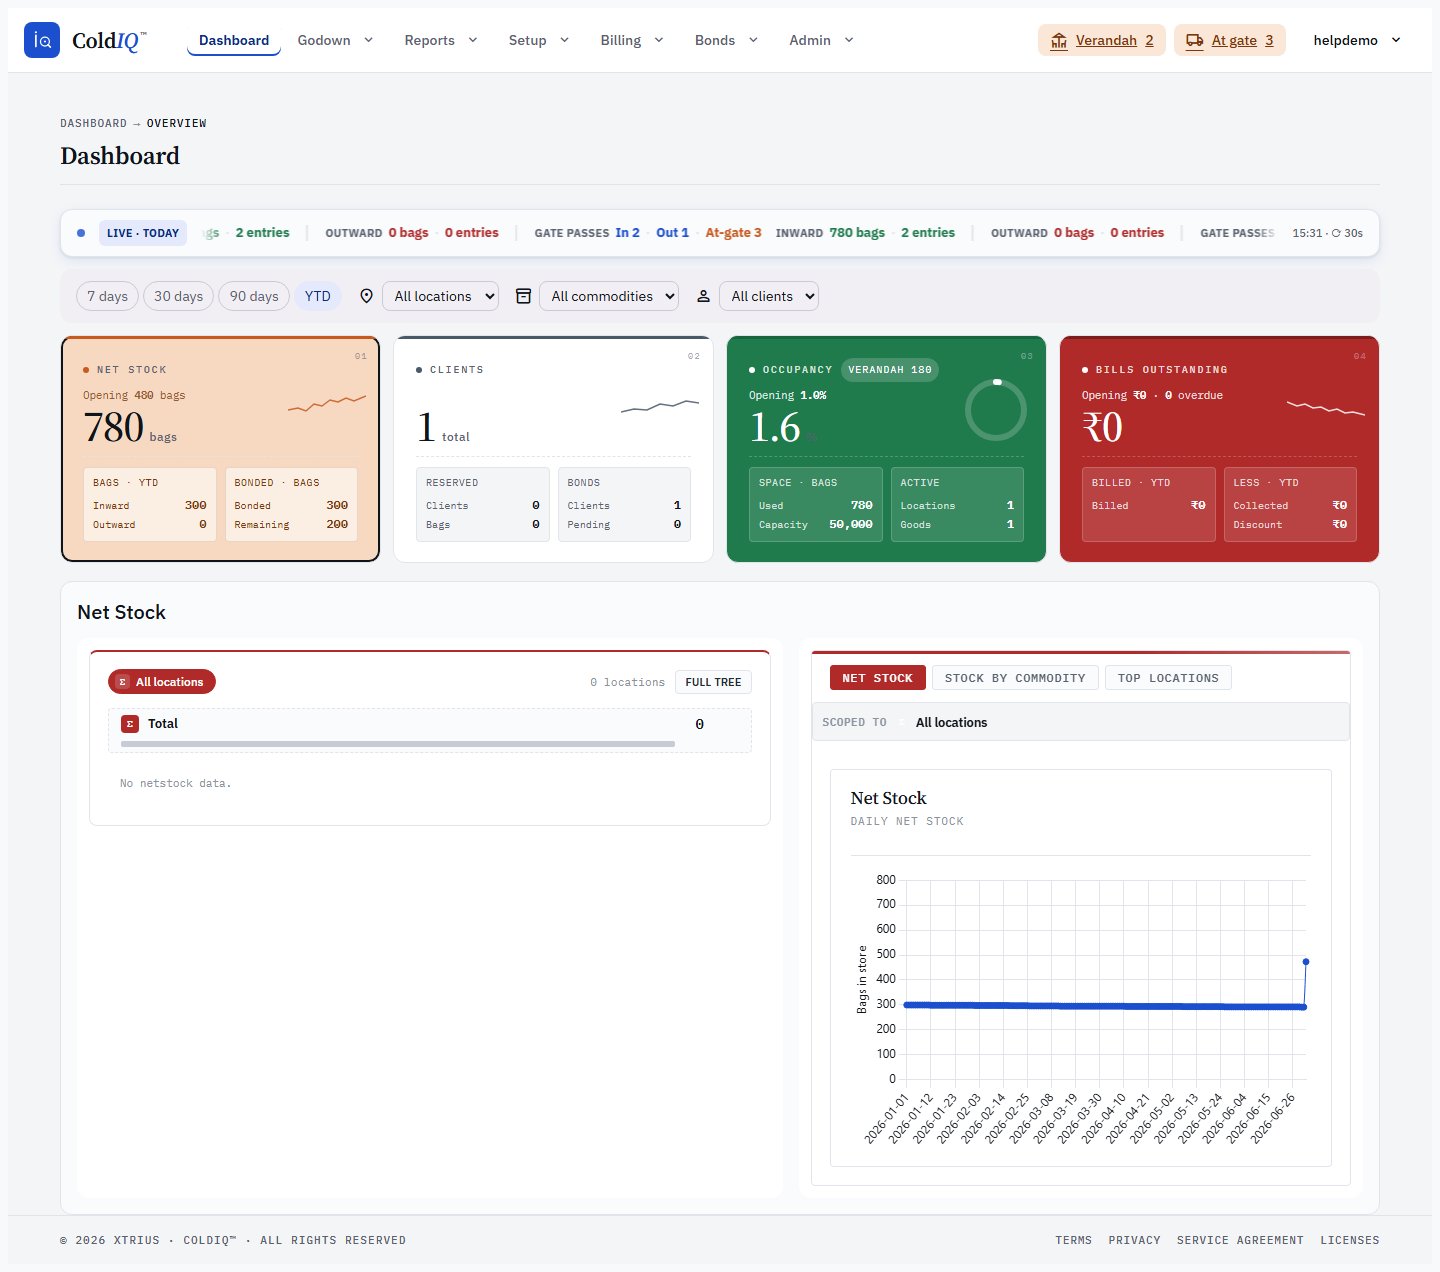
The ranked list (left)
The list shows one row per child of whatever you are focused on, ranked by that tile's headline metric, each with a green→red bar showing its share of the parent, its sub-numbers inline, and a Σ total reference row. A breadcrumb strip tracks how deep you have drilled.
- Net Stock ranks by net flow, with inward / outward as sub-numbers.
- Occupancy ranks by capacity, with used / utilisation-% as sub-numbers.
- Clients ranks by net stock, with reserved as a sub-number.
- Bills Outstanding ranks by outstanding ₹, with billed / paid as sub-numbers.
The breakdown hierarchies are:
| Tile | Drills down through |
|---|---|
| Net Stock | Location → Commodity → Chamber |
| Occupancy | Location → Chamber → Floor → Bin → Slot |
| Bills Outstanding | Aging bucket → Client → Bill |
| Clients | Top clients → their locations |
Clicking a row vs. drilling deeper. A single click on a row highlights it — only the charts on the right update to that selection (for Net Stock, the trend even overlays the selection's own line against a faded "parent" line for context). The chevron on a row is what drills a level deeper and re-roots the whole view.
The charts (right)
Each tile's drilldown offers its own chart tabs:
- Net Stock
- Net Stock — a daily running-balance line (never dips below zero).
- Stock by commodity — inward vs outward and the net, per commodity.
- Top locations — ranked by net stock.
- Occupancy
- Capacity — bars coloured by how full each unit is; the level follows your focus (locations → chambers → floors → bins).
- Stock by commodity — current net stock per commodity.
- Verandah — pending (not-yet-put-away) bags per location.
- Bills Outstanding
- Top debtors — outstanding ₹ per client, largest first.
- Clients
- Net Stock by Clients — current net stock per client, coloured by client type (focus a single client to see it split per location).
- Revenue — revenue and outstanding, stacked, per client.
- Lifetime Value — top clients by all-time billed revenue (ignores the date chip by design).
- Billed (reached from the Bills drilldown / matrix rather than its own tile)
- Monthly revenue — daily billed per commodity across the last 12 months.
- Days held — average days stored per commodity.
- Clients by revenue — top 10 clients, stacked by commodity.
Row-level chips (commodity, chamber, floor, client, aging bucket) show what you have filtered to, each with a one-click clear.
Two rules worth knowing
Occupancy always equals Net Stock. Both the Occupancy "used" figure and the Net Stock headline come from the same point-in-time calculation, so they can never disagree. Because it is a snapshot, the date chip does not change either one — earlier movement is folded into "opening". Bags in the verandah or at the gate (with no slot yet) still count as used and show up as an "unassigned" slice, which is why occupancy can read above 100%.
Bills are located by their delivery, not stored on the bill. A bill has no location of its own. The dashboard places each bill at its delivery location (or, for a period bill with no delivery, its intake location). A bill that can't be tied to either lands under a "—" node. If you clear the Location filter to nothing selected, the money tiles read zero — an empty selection means "none", never "all".
If a number looks wrong
- A tile didn't move when I changed the date — expected for Net Stock and Occupancy headlines and for the money headlines; those are snapshots / lifetime figures. Watch the mini-cards and charts for date-driven movement.
- Occupancy is over 100% — verandah / at-gate bags with no assigned slot. Put them away (approve from the Verandah pill) and it settles.
- The money tiles show zero — check the Location filter isn't cleared to nothing; an empty selection returns zero by design.
- I only see two tiles — that's the staff view. The money tiles are shown to revenue roles only.
- Numbers lag after a booking — the tiles cache briefly (about 30 seconds) and multi-worker deployments can take a moment; reload to force a refresh.